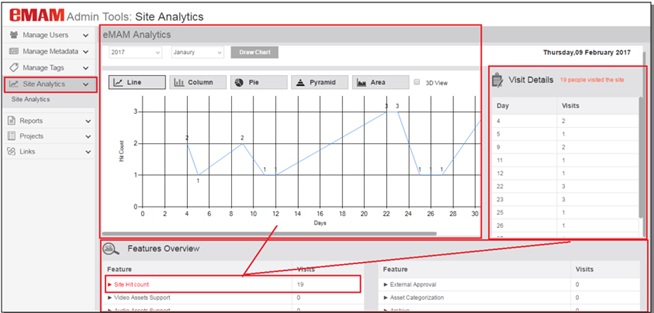
What is the use of "Site Analytics" tab in the Admin Tools page?
Admin users can also use Site
Analytics report to analyze eMAM Features usage. It can also be used to
generate a graph with the number of hits plotted for the complete site
during the month/year. It provides an overall exhibit about user
activities of eMAM application features. Based on the feature selected
under Features Overview at the bottom panel, Visit details and Chart
changes on top panel.

- Site Hit count Displays the number of times (also graphical representation) users have logged into the eMAM system.
- Video Assets Support Displays the number of times (also graphical representation) users have used the video assets.
- Audio Assets Support Displays the number of times (also graphical representation) users have used the audio assets.
- Image Assets Support Displays the number of times (also graphical representation) users have used the image assets.
- Other Assets Support Displays the number of times (also graphical representation) users have used the other files from the eMAM System.
- Projects Displays the number of times (also graphical representation) users have viewed the project feature.
- Advanced Search Displays the number of times (also graphical representation) users have used the advanced search feature.
- Custom Metadata Displays the number of times (also graphical representation) users have used the custom metadata feature.
- Annotations Displays the number of times (also graphical representation) users have used the annotations feature.
- Proxy Editing Displays the number of times (also graphical representation) users have used the proxy editing feature.
- Rating Displays the number of times (also graphical representation) users have used the rating feature.
- Internal Approval Displays the number of times (also graphical representation) users have used the internal approval feature.
- External Approval Displays the number of times (also graphical representation) users have used the external approval feature.
- Asset Categorization Displays the number of times (also graphical representation) users have used the category feature.
- Archive Displays the number of times (also graphical representation) users have used the archive feature.
- Delivery To FTP Displays the number of times (also graphical representation) users have used the delivery To FTP feature.
- Report by Asset History Displays the number of times (also graphical representation) users have viewed the asset history report.
- Report by Asset Type Displays the number of times (also graphical representation) users have viewed the asset state report.
- Report by User Displays the number of times (also graphical representation) users have viewed the user history report.
- Live Dashboard Displays the number of times (also graphical representation) users have visited the live dashboard.
- Site Analytics Displays the number of times (also graphical representation) users have used the site analytics feature.
- Delivery to Network Displays the number of times (also graphical representation) users have used the Delivery to Network feature.
- Restore Displays the number of times (also graphical representation) users have used the restore feature.
For any further assistance, please contact eMAM Support at support@emamonline.com
Related Articles
What all admin functions can be performed using Admin Tools widget?
Administrative tools widget can be used to manage and perform many administrative tasks such as: Note: Admin Tools widget is only available for Unit Admins. Manage Users, Manage Asset types, Manage Metadata, Manage Tags, Site Analytics, Projects, ...eMAM Super Admin Console 5.1
Please find the attachment.eMAM Super Admin Console User Guide v5.3
Please find the below attachment,What is the use of "Projects" function under Admin Tools widget?
Unit Admins can manage project status and its color codes using Projects function in the Admin Tools widget. Click on Edit button adjacent to any statuses listed and update the status name and choose a custom color by clicking on the color radial ...Which are the different types of custom metadata fields that can be created in eMAM?
In the Admin Tools page, under Manage Metadata tab, eMAM users can create a variety of different types of custom metadata fields like: o Text: Select text radial button to create text metadata field type. Field length will by default display MAX (no ...